Introduction Formats Cancer Study Cancer Type Clinical Data Discrete Copy Number Data Continuous Copy Number Data Segmented Data Expression Data Mutation Data Structural Variant Data Fusion Data (DEPRECATED)Methylation Data Protein level Data Case Lists Timeline Data GISTIC 2.0 Data Mutsig Data Gene Panel Data Gene Set Data Study Tags file Generic Assay Arm Level CNA Data Mutational Signature Data
Resource Data Custom namespace columns
Introduction
This page describes the file formats that cancer study data should assume in order to be successfully imported into the database. Unless otherwise noted, all data files are in tabular-TSV (tab separated value) format and have an associated metadata file which is in a multiline record format. The metadata and data files should follow a few rules documented at the Data Loading page.
Formats
Cancer Study
As described in the Data Loading tool page, the following file is needed to describe the cancer study:
Meta file
This file contains metadata about the cancer study. The file contains the following fields:
- type_of_cancer: The cancer type abbreviation, e.g., "brca". This should be the same cancer type as specified in the
meta_cancer_type.txtfile, if available. The type can be "mixed" for studies with multiple cancer types. - cancer_study_identifier: A string used to uniquely identify this cancer study within the database, e.g., "brca_joneslab_2013".
- name: The name of the cancer study, e.g., "Breast Cancer (Jones Lab 2013)".
- description: A description of the cancer study, e.g., "Comprehensive profiling of 103 breast cancer samples. Generated by the Jones Lab 2013". This description may contain one or more URLs to relevant information.
- citation (Optional): A relevant citation, e.g., "TCGA, Nature 2012".
- pmid (Optional): One or more relevant pubmed ids (comma separated without whitespace). If used, the field citation has to be filled, too.
- groups (Optional): When using an authenticating cBioPortal, lists the user-groups that are allowed access to this study. Multiple groups are separated with a semicolon ";". The study will be invisible to users not in at least one of the listed groups, as if it wasn't loaded at all. e.g., "PUBLIC;GDAC;SU2C-PI3K". see User-Authorization for more information on groups
- add_global_case_list (Optional): set to 'true' if you would like the "All samples" case list to be generated automatically for you. See also
Case lists . - tags_file (Optional): the file name containing custom study tags for the
study tags . - reference_genome (Optional): the study reference genome (e.g.
hg19,hg38). Without specifying this property, the study will be assigned to the reference genome specified inapplication.properties(propertyucsc.build).
Example
An example meta_study.txt file would be:
type_of_cancer: brca
cancer_study_identifier: brca_joneslab_2013
name: Breast Cancer (Jones Lab 2013)
description: Comprehensive profiling of 103 breast cancer samples. Generated by the Jones Lab 2013.
add_global_case_list: true
Cancer Type
If the type_of_cancer specified in the meta_study.txt does not yet exist in the type_of_cancer database table, a meta_cancer_type.txt file is also mandatory.
Meta file
The file is comprised of the following fields:
- genetic_alteration_type: CANCER_TYPE
- datatype: CANCER_TYPE
- data_filename: your datafile
Example
An example meta_cancer_type.txt file would be:
genetic_alteration_type: CANCER_TYPE
datatype: CANCER_TYPE
data_filename: cancer_type.txt
Data file
The file is comprised of the following columns in the order specified:
- type_of_cancer: The cancer type abbreviation, e.g., "brca".
- name: The name of the cancer type, e.g., "Breast Invasive Carcinoma".
- dedicated_color: CSS color name of the color associated with this cancer study, e.g., "HotPink". See this list for supported names, and follow the awareness ribbons color schema. This color is associated with the cancer study on various web pages within the cBioPortal.
- parent_type_of_cancer: The
type_of_cancerfield of the cancer type of which this is a subtype, e.g., "Breast". ℹ️ : you can set parent totissue, which is the reserved word to place the given cancer type at "root" level in the "studies oncotree" that will be generated in the homepage (aka query page) of the portal.
Example
An example record would be:
brca<TAB>Breast Invasive Carcinoma<TAB>HotPink<TAB>BreastClinical Data
The clinical data is used to capture both clinical attributes and the mapping between patient and sample ids. The software supports multiple samples per patient.
As of March 2016, the clinical file is split into a patient clinical file and a sample clinical file. The sample file is required, whereas the patient file is optional. cBioPortal has specific functionality for a core set of patient and sample columns, but can also display custom columns (see section
Meta files
The two clinical metadata files (or just one metadata file if you choose to leave the patient file out) have to contain the following fields:
- cancer_study_identifier: same value specified in meta_study.txt
- genetic_alteration_type: CLINICAL
- datatype: PATIENT_ATTRIBUTES or SAMPLE_ATTRIBUTES
- data_filename: your datafile
Examples
An example metadata file, e.g. named meta_clinical_sample.txt, would be:
cancer_study_identifier: brca_tcga_pub
genetic_alteration_type: CLINICAL
datatype: SAMPLE_ATTRIBUTES
data_filename: data_clinical_sample.txt
An example metadata file, e.g. named meta_clinical_patient.txt, would be:
cancer_study_identifier: brca_tcga_pub
genetic_alteration_type: CLINICAL
datatype: PATIENT_ATTRIBUTES
data_filename: data_clinical_patient.txt
Data files
For both patients and samples, the clinical data file is a two dimensional matrix with multiple clinical attributes. When the attributes are defined in the patient file they are considered to be patient attributes; when they are defined in the sample file they are considered to be sample attributes.
The first four rows of the clinical data file contain tab-delimited metadata about the clinical attributes. These rows have to start with a '#' symbol. Each of these four rows contain different type of information regarding each of the attributes that are defined in the fifth row:
- Row 1: The attribute Display Names: The display name for each clinical attribute
- Row 2: The attribute Descriptions: Long(er) description of each clinical attribute
- Row 3: The attribute Datatype: The datatype of each clinical attribute (must be one of: STRING, NUMBER, BOOLEAN)
-
Row 4: The attribute Priority: A number which indicates the importance of each attribute. In the future, higher priority attributes will appear in more prominent places than lower priority ones on relevant pages (such as the Study View). A higher number indicates a higher priority.
To promote a chart in Study View, increase its priority value. To hide a chart, set its priority to 0. For combination charts, the chart is hidden when any of the clinical attributes used by the chart has priority 0.
cBioPortal preassigns priority values to a few charts. Assigning any priority other than 1 overrides these defaults:
Priority is not the only factor determining which chart is displayed first. A layout algorithm in Study View also adjusts chart placement. The layout is arranged on a grid of chart slots: most charts occupy a single 1 by 1 slot, while the Mutated Genes Table spans a 2 by 2 block of slots. When a chart cannot be placed in the first grid, an additional grid is generated with lower priority than the first one. If a later chart can still fit into the first grid, then its priority is promoted.
See Study View customization for more detailed information about how Study View uses priority and how the layout is calculated.
- Row 5: The attribute name for the database: This name should be in upper case.
- Row 6: This is the first row that contains actual data.
Example clinical header
Below is an example of the first 4 rows with the respective metadata for the attributes defined in the 5th row.
#Patient Identifier<TAB>Overall Survival Status<TAB>Overall Survival (Months)<TAB>Disease Free Status<TAB>Disease Free (Months)<TAB>...
#Patient identifier<TAB>Overall survival status<TAB>Overall survival in months since diagnosis<TAB>Disease free status<TAB>Disease free in months since treatment<TAB>...
#STRING<TAB>STRING<TAB>NUMBER<TAB>STRING<TAB>NUMBER<TAB>...
#1<TAB>1<TAB>1<TAB>1<TAB>1<TAB>
PATIENT_ID<TAB>OS_STATUS<TAB>OS_MONTHS<TAB>DFS_STATUS<TAB>DFS_MONTHS<TAB>...
....
data - see examples below
....
Clinical patient columns
The file containing the patient attributes has one required column:
- PATIENT_ID (required): a unique patient ID. This field allows only numbers, letters, points, underscores and hyphens.
The following columns are used by the study view as well as the patient view. In the study view they are used to create the survival plots. In the patient view they are used to add information to the header.
Note on survival plots: to generate the survival plots successfully, the columns are required to be in pairs, which means the file should have a pair of columns that have the same prefix but ending with _STATUS and _MONTHS individually. For example, PFS_STATUS and PFS_MONTHS are a valid pair of columns that can generate the survival plots.
Note on survival status value: the value of survival status must prefixed with 0: or 1:. Value with prefix 0: means that no event (e.g. LIVING, DiseaseFree). Value with prefix 1: means that an event occurred (e.g. DECEASED, Recurred/Progressed).
- OS_STATUS: Overall patient survival status
- Possible values: 1:DECEASED, 0:LIVING
- In the patient view, 0:LIVING creates a green label, 1:DECEASED a red label.
- OS_MONTHS: Overall survival in months since initial diagnosis
- DFS_STATUS: Disease free status since initial treatment
- Possible values: 0:DiseaseFree, 1:Recurred/Progressed
- In the patient view, 0:DiseaseFree creates a green label, 1:Recurred/Progressed a red label.
- DFS_MONTHS: Disease free (months) since initial treatment
These columns, when provided, add additional information to the patient description in the header:
- PATIENT_DISPLAY_NAME: Patient display name (string)
- GENDER or SEX: Gender or sex of the patient (string)
- AGE: Age at which the condition or disease was first diagnosed, in years (number)
- TUMOR_SITE
Custom attributes:
- Custom Clinical Attribute Headers: Any other custom attribute can be added as well. See section
"Custom columns in clinical data" .
Example patient data file
#Patient Identifier<TAB>Overall Survival Status<TAB>Overall Survival (Months)<TAB>Disease Free Status<TAB>Disease Free (Months)<TAB>...
#Patient identifier<TAB>Overall survival status<TAB>Overall survival in months since diagnosis<TAB>Disease free status<TAB>Disease free in months since treatment<TAB>...
#STRING<TAB>STRING<TAB>NUMBER<TAB>STRING<TAB>NUMBER<TAB>...
#1<TAB>1<TAB>1<TAB>1<TAB>1<TAB>
PATIENT_ID<TAB>OS_STATUS<TAB>OS_MONTHS<TAB>DFS_STATUS<TAB>DFS_MONTHS<TAB>...
PATIENT_ID_1<TAB>1:DECEASED<TAB>17.97<TAB>1:Recurred/Progressed<TAB>30.98<TAB>...
PATIENT_ID_2<TAB>0:LIVING<TAB>63.01<TAB>0:DiseaseFree<TAB>63.01<TAB>...
...
Clinical sample columns
The file containing the sample attributes has two required columns:
- PATIENT_ID (required): A patient ID. This field can only contain numbers, letters, points, underscores and hyphens.
- SAMPLE_ID (required): A sample ID. This field can only contain numbers, letters, points, underscores and hyphens.
By adding PATIENT_ID here, cBioPortal will map the given sample to this patient. This enables one to associate multiple samples to one patient. For example, a single patient may have had multiple biopsies, each of which has been genomically profiled. See this example for a patient with multiple samples.
The following columns are required for the pan-cancer summary statistics tab (example).
- CANCER_TYPE: Cancer Type
- CANCER_TYPE_DETAILED: Cancer Type Detailed, a sub-type of the specified CANCER_TYPE
The following columns affect the header of the patient view by adding text to the samples in the header:
- SAMPLE_DISPLAY_NAME: displayed in addition to the ID
- SAMPLE_CLASS
- METASTATIC_SITE or PRIMARY_SITE: Override TUMOR_SITE (patient level attribute) depending on sample type
The following columns additionally affect the
- OTHER_SAMPLE_ID: OTHER_SAMPLE_ID is no longer supported. Please replace this column header with SAMPLE_ID.
- SAMPLE_TYPE, TUMOR_TISSUE_SITE or TUMOR_TYPE: gives sample icon in the timeline a color.
- If set to
recurrence,recurred,progressionorprogressed: orange - If set to
metastaticormetastasis: red - If set to
primaryor otherwise: black
- If set to
Custom attributes:
- Custom Clinical Attribute Headers: Any other custom attribute can be added as well. See section
"Custom columns in clinical data" .
Example sample data file
#Patient Identifier<TAB>Sample Identifier<TAB>Subtype<TAB>...
#Patient identifier<TAB>Sample Identifier<TAB>Subtype description<TAB>...
#STRING<TAB>STRING<TAB>STRING<TAB>...
#1<TAB>1<TAB>1<TAB>...
PATIENT_ID<TAB>SAMPLE_ID<TAB>SUBTYPE<TAB>...
PATIENT_ID_1<TAB>SAMPLE_ID_1<TAB>basal-like<TAB>...
PATIENT_ID_2<TAB>SAMPLE_ID_2<TAB>Her2 enriched<TAB>...
...
Columns with specific functionality
These columns can be in either the patient or sample file.
- CANCER_TYPE: Overrides study wide cancer type
- CANCER_TYPE_DETAILED
- KNOWN_MOLECULAR_CLASSIFIER
- GLEASON_SCORE: Radical prostatectomy Gleason score for prostate cancer
- HISTOLOGY
- TUMOR_STAGE_2009
- TUMOR_GRADE
- ETS_RAF_SPINK1_STATUS
- TMPRSS2_ERG_FUSION_STATUS
- ERG_FUSION_ACGH
- SERUM_PSA
- DRIVER_MUTATIONS
Custom columns in clinical data
cBioPortal supports custom columns with clinical data in either the patient or sample file. They should follow the previously described 5-row header format. Be sure to provide the correct Datatype, for optimal search, sorting, filtering (in clinical data tab) and visualization.
The Clinical Data Dictionary from MSKCC is used to normalize clinical data, and should be followed to make the clinical data comparable between studies. This dictionary provides a definition whether an attribute should be defined on the patient or sample level, as well as provides a name, description and datatype. The data curator can choose to ignore these proposed definitions, but not following this dictionary might make comparing data between studies more difficult. It should however not break any cBioPortal functionality. See the Clinical Data Dictionary endpoint for the data dictionary of all known clinical attributes.
Banned column names
MUTATION_COUNT and FRACTION_GENOME_ALTERED are auto populated clinical attributes, and should therefore not be present in clinical data files.
Discrete Copy Number Data
The discrete copy number data file contain values that would be derived from copy-number analysis algorithms like GISTIC 2.0 or RAE. GISTIC 2.0 can be installed or run online using the GISTIC 2.0 module on GenePattern. For some help on using GISTIC 2.0, check the Data Loading: Tips and Best Practices page. When loading case list data, the _cna case list is required. See the
Wide vs Long format
For CNA data two formats are supported: the wide, and the long format:
- Wide format: a matrix, where each row is a gene, and each column is a sample
- Long format: not a matrix, each row is a gene-sample combination; this makes the file longer
Wide format
Meta file
The meta file is comprised of the following fields:
- cancer_study_identifier: same value as specified in
study meta file - genetic_alteration_type: COPY_NUMBER_ALTERATION
- datatype:
DISCRETE - stable_id: gistic, cna, cna_rae or cna_consensus
- show_profile_in_analysis_tab: true
- profile_name: A name for the discrete copy number data, e.g., "Putative copy-number alterations from GISTIC"
- profile_description: A description of the copy number data, e.g., "Putative copy-number from GISTIC 2.0. Values: -2 = homozygous deletion; -1 = hemizygous deletion; 0 = neutral / no change; 1 = gain; 2 = high level amplification."
- data_filename: your datafile
- gene_panel (Optional): gene panel stable id
- pd_annotations_filename (Optional): name of
custom driver annotations file
Example
An example metadata file could be named meta_cna.txt and its contents could be:
cancer_study_identifier: brca_tcga_pub
genetic_alteration_type: COPY_NUMBER_ALTERATION
datatype: DISCRETE
stable_id: gistic
show_profile_in_analysis_tab: true
profile_name: Putative copy-number alterations from GISTIC
profile_description: Putative copy-number from GISTIC 2.0. Values: -2 = homozygous deletion; -1 = hemizygous deletion; 0 = neutral / no change; 1 = gain; 2 = high level amplification.
data_filename: data_cna.txt
pd_annotations_filename: data_cna_pd_annotations.txt
Data file
For each gene (row) in the data file, the following columns are required in the order specified:
One or both of:
- Hugo_Symbol: A HUGO gene symbol.
- Entrez_Gene_Id: A Entrez Gene identifier.
And:
- An additional column for each sample in the dataset using the sample id as the column header.
For each gene-sample combination, a copy number level is specified:
- "-2" is a deep loss, possibly a homozygous deletion
- "-1" is a single-copy loss (heterozygous deletion)
- "0" is diploid
- "1" indicates a low-level gain
- "2" is a high-level amplification.
Example
An example data file which includes the required column header would look like:
Hugo_Symbol<TAB>Entrez_Gene_Id<TAB>SAMPLE_ID_1<TAB>SAMPLE_ID_2<TAB>...
ACAP3<TAB>116983<TAB>0<TAB>-1<TAB>...
AGRN<TAB>375790<TAB>2<TAB>0<TAB>...
...
...
Long format
Meta file
The meta file of wide format is comprised of the following fields:
-
cancer_study_identifier: same value as specified in
study meta file -
genetic_alteration_type: COPY_NUMBER_ALTERATION
-
datatype:
DISCRETE_LONGNote: It will end up as datatypeDISCRETEin the database, because the LONG data format is only relevant while importing. -
stable_id: gistic, cna, cna_rae or cna_consensus
-
show_profile_in_analysis_tab: true
-
profile_name: A name for the discrete copy number data, e.g., "Putative copy-number alterations from GISTIC"
-
profile_description: A description of the copy number data, e.g., "Putative copy-number from GISTIC 2.0. Values: -2 = homozygous deletion; -1 = hemizygous deletion; 0 = neutral / no change; 1 = gain; 2 = high level amplification."
-
data_filename: your datafile
-
gene_panel (Optional): gene panel stable id
-
namespaces (Optional): Comma-delimited list of
namespacesto import.
Example
An example metadata file could be named meta_cna.txt and its contents could be:
cancer_study_identifier: brca_tcga_pub
genetic_alteration_type: COPY_NUMBER_ALTERATION
datatype: DISCRETE_LONG
stable_id: gistic
show_profile_in_analysis_tab: true
profile_name: Putative copy-number alterations from GISTIC
profile_description: Putative copy-number from GISTIC 2.0. Values: -2 = homozygous deletion; -1 = hemizygous deletion; 0 = neutral / no change; 1 = gain; 2 = high level amplification.
data_filename: data_cna.txt
namespaces: MyNamespace,MyNamespace2
Data file
Each row contains a row-sample combination. Custom driver annotations are added as columns to the data file, just like custom namespace columns.
Example
An example data file which includes the required column header would look like:
Hugo_Symbol	Entrez_Gene_Id	Sample_Id	Value	cbp_driver	cbp_driver_annotation	cbp_driver_tiers	cbp_driver_tiers_annotation	MyNamespace.column1
ACAP3	116983	TCGA-A2-A04U-01	2	Putative_Passenger	Test passenger	Class 2	Class annotation	value1
...
Adding your own discrete copy number columns
Additional columns can be added to the discrete copy number long data file. In this way, the portal will parse and store your own CNA fields in the database.
See
Custom driver annotations file
Custom driver annotations can be defined for discrete copy number data. These annotations can be used to complement or replace default driver annotation resources OncoKB and HotSpots.
Custom driver annotations can be placed in a separate file that is referenced by the pd_annotations_file field of the meta file. The annotation file can hold the following columns:
- Hugo_Symbol (Optional): A HUGO gene symbol. Required when column
Entrez_Gene_Idis not present. - Entrez_Gene_Id (Optional): A Entrez Gene identifier. Required when column
Hugo_Symbolis not present. - SAMPLE_ID: A sample ID. This field can only contain numbers, letters, points, underscores and hyphens.
- cbp_driver (Optional): "Putative_Driver", "Putative_Passenger", "Unknown", "NA" or "" (empty value). This field must be present if the cbp_driver_annotation is also present in the MAF file.
- cbp_driver_annotation (Optional): Description field for the cbp_driver value (limited to 80 characters). This field must be present if the cbp_driver is also present in the MAF file. This field is free text. Example values for this field are: "Pathogenic" or "VUS".
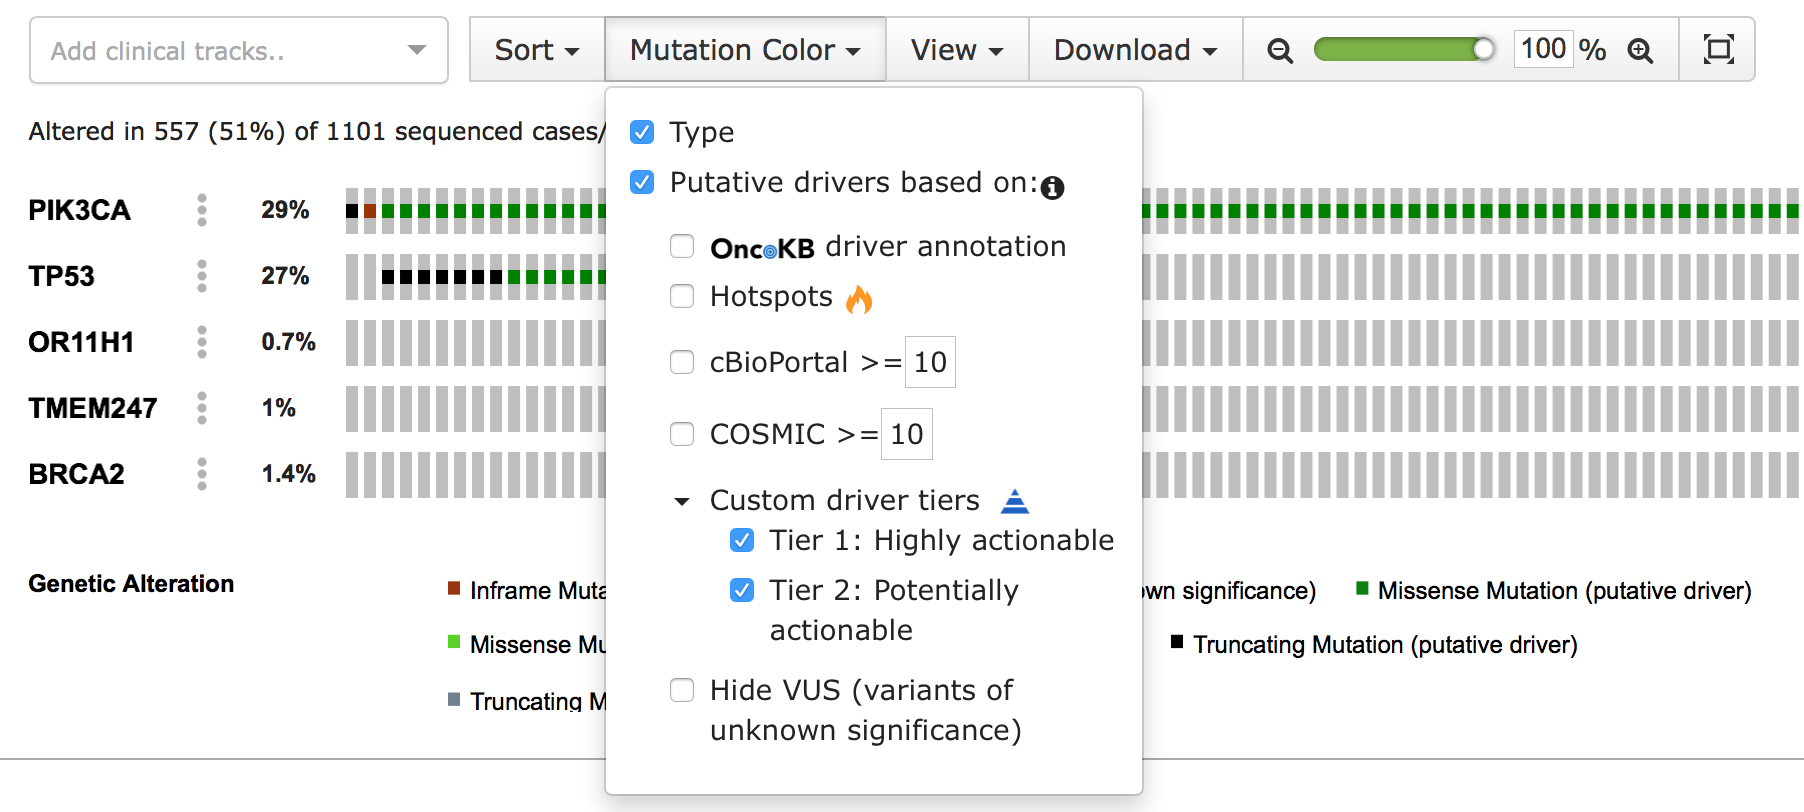
- cbp_driver_tiers (Optional): Free label/category that marks the mutation as a putative driver such as "Driver", "Highly actionable", "Potential drug target". . This field must be present if the cbp_driver_tiers_annotation is also present in the MAF file. In the OncoPrint view's Mutation Color dropdown menu, these tiers are ordered alphabetically. This field is free text and limited to 20 characters. For mutations without a custom annotation, leave the field blank or type "NA".
- cbp_driver_tiers_annotation (Optional): Description field for the cbp_driver_tiers value (limited to 80 characters). This field must be present if the cbp_driver_tiers is also present in the MAF file. This field can not be present when the cbp_driver_tiers field is not present.
All genes referenced in the custom driver annotation file must be present in the data file for discrete copy number alterations.
The cbp_driver column flags the mutation as either driver or passenger. In cBioPortal, passenger mutations are also known as variants of unknown significance (VUS). The cbp_driver_tiers column assigns an annotation tier to the mutation, such as "Driver", "Highly actionable" or "Potential drug target". When a tier is selected, mutations with that annotation are highlighted as driver. Both types of custom annotations contain a second column with the suffix _annotation, to add a description. This is displayed in the tooltip that appears when hovering over the sample's custom annotation icon in the OncoPrint view.
You can learn more about configuring these annotations in the application.properties documentation. When properly configured, the customized annotations appear in the "Mutation Color" menu of the OncoPrint view:
Example
An example data file which includes the required column header would look like:
SAMPLE_ID<TAB>Hugo_Symbol<TAB>Entrez_Gene_Id<TAB>cbp_driver<TAB>cbp_driver_annotation<TAB>cbp_driver_tiers<TAB>cbp_driver_tiers_annotation<TAB>...
TCGA-BH-A0E6-01<TAB>GENEA<TAB>116983<TAB>Putative_Driver<TAB>see: PMID:12345678<TAB>Highly actionable<TAB>Per decision 01/01/2020<TAB>
TCGA-BH-A0E6-01<TAB>GENEB<TAB>375790<TAB>Putative_Passenger<TAB>see: PMID:12345678<TAB><TAB><TAB>
...
GISTIC 2.0 Format
GISTIC 2.0 outputs a tabular file similarly formatted to the cBioPortal format, called <prefix>_all_thresholded.by_genes.txt.
In this file the gene symbol is found in the Gene Symbol column, while Entrez gene IDs are in the Gene ID or
Locus ID column. Please rename Gene Symbol to Hugo_Symbol and Gene ID or Locus ID to Entrez_Gene_Id. The
Cytoband column can be kept in the table, but note that these values are ignored in cBioPortal. cBioPortal uses
cytoband annotations from the map_location column in NCBI's Homo_sapiens.gene_info.gz when loading genes into
the seed database.
Continuous Copy Number Data
Meta file
The continuous copy number metadata file should contain the following fields:
- cancer_study_identifier: same value as specified in
study meta file - genetic_alteration_type: COPY_NUMBER_ALTERATION.
- datatype: CONTINUOUS
- stable_id: linear_CNA
- show_profile_in_analysis_tab: false.
- profile_name: A name for the copy number data, e.g., "copy-number values".
- profile_description: A description of the copy number data, e.g., "copy-number values for each gene (from Affymetrix SNP6).".
- data_filename: your datafile
- gene_panel (Optional): gene panel stable id
cBioPortal also supports log2 copy number data. If your data is in log2, change the following fields:
- datatype: LOG2-VALUE
- stable_id: log2CNA
Example
An example metadata file, e.g. meta_log2_cna.txt, would be:
cancer_study_identifier: brca_tcga_pub
genetic_alteration_type: COPY_NUMBER_ALTERATION
datatype: LOG2-VALUE
stable_id: log2CNA
show_profile_in_analysis_tab: false
profile_description: Log2 copy-number values for each gene (from Affymetrix SNP6).
profile_name: Log2 copy-number values
data_filename: data_log2_cna.txt
Data file
The log2 copy number data file follows the same format as expression data files. See
GISTIC 2.0 Format
GISTIC 2.0 outputs a tabular file similarly formatted to the cBioPortal format, called <prefix>_all_data_by_genes.txt.
In this file the gene symbol is found in the Gene Symbol column, while Entrez gene IDs are in the Gene ID or
Locus ID column. Please rename Gene Symbol to Hugo_Symbol and Gene ID or Locus ID to Entrez_Gene_Id. The
Cytoband column can be kept in the table, but note that these values are ignored in cBioPortal. cBioPortal uses
cytoband annotations from the map_location column in NCBI's Homo_sapiens.gene_info.gz when loading genes into
the seed database.
Segmented Data
A SEG file (segmented data; .seg or .cbs) is a tab-delimited text file that lists loci and associated numeric values. The segmented data file format is the output of the Circular Binary Segmentation algorithm (Olshen et al., 2004). This Segment data enables the 'CNA' lane in the Genomic overview of the Patient view (as can be seen in this example).
Meta file
The segmented metadata file should contain the following fields:
- cancer_study_identifier: same value as specified in
study meta file - genetic_alteration_type: COPY_NUMBER_ALTERATION
- datatype: SEG
- reference_genome_id: Reference genome version. Supported values: "hg19"
- description: A description of the segmented data, e.g., "Segment data for the XYZ cancer study.".
- data_filename: your datafile
Example:
An example metadata file, e.g. meta_cna_hg19_seg.txt, would be:
cancer_study_identifier: brca_tcga_pub
genetic_alteration_type: COPY_NUMBER_ALTERATION
datatype: SEG
reference_genome_id: hg19
description: Somatic CNA data (copy number ratio from tumor samples minus ratio from matched normals) from TCGA.
data_filename: data_cna_hg19.seg
Data file
The first row contains column headings and each subsequent row contains a locus and an associated numeric value. See also the Broad IGV page on this format.
Example:
An example data file which includes the required column header would look like:
ID<TAB>chrom<TAB>loc.start<TAB>loc.end<TAB>num.mark<TAB>seg.mean
SAMPLE_ID_1<TAB>1<TAB>3208470<TAB>245880329<TAB>128923<TAB>0.0025
SAMPLE_ID_2<TAB>2<TAB>474222<TAB>5505492<TAB>2639<TAB>-0.0112
SAMPLE_ID_2<TAB>2<TAB>5506070<TAB>5506204<TAB>2<TAB>-1.5012
SAMPLE_ID_2<TAB>2<TAB>5512374<TAB>159004775<TAB>80678<TAB>-0.0013
...
...
Expression Data
An expression data file is a two dimensional matrix with a gene per row and a sample per column. For each gene-sample pair, a real number represents the gene expression in that sample.
Meta file
The expression metadata file should contain the following fields:
- cancer_study_identifier: same value as specified in
study meta file - genetic_alteration_type: MRNA_EXPRESSION
- datatype: CONTINUOUS, DISCRETE or Z-SCORE
- stable_id: see table below.
- source_stable_id: Required when both conditions are true: (1)
datatype=Z-SCOREand (2) this study containsGSVA data . Should containstable_idof the expression file for which thisZ-SCORE file is the statistic . - show_profile_in_analysis_tab: false (you can set to true if Z-SCORE to enable it in the oncoprint, for example).
- profile_name: A name for the expression data, e.g., "mRNA expression (microarray)".
- profile_description: A description of the expression data, e.g., "Expression levels (Agilent microarray).".
- data_filename: your datafile
- gene_panel (Optional): gene panel stable id
Supported stable_id values for MRNA_EXPRESSION
For historical reasons, cBioPortal expects the stable_id to be one of those listed in the following static set.
The stable_id for continuous RNA-seq data has two options: rna_seq_mrna or rna_seq_v2_mrna. These options were added to distinguish between two different TCGA pipelines, which perform different types of normalization (RPKM and RSEM). However, for custom datasets either one of these stable_id can be chosen.
| datatype | stable_id | description |
|---|---|---|
| CONTINUOUS | mrna_U133 | Affymetrix U133 Array |
| Z-SCORE | mrna_U133_Zscores | Affymetrix U133 Array |
| Z-SCORE | rna_seq_mrna_median_Zscores | RNA-seq data |
| Z-SCORE | mrna_median_Zscores | mRNA data |
| CONTINUOUS | rna_seq_mrna | RNA-seq data |
| CONTINUOUS | rna_seq_v2_mrna | RNA-seq data |
| Z-SCORE | rna_seq_v2_mrna_median_Zscores | RNA-seq data |
| CONTINUOUS | mirna | MicroRNA data |
| Z-SCORE | mirna_median_Zscores | MicroRNA data |
| Z-SCORE | mrna_merged_median_Zscores | ? |
| CONTINUOUS | mrna | mRNA data |
| DISCRETE | mrna_outliers | mRNA data of outliers |
| Z-SCORE | mrna_zbynorm | ? |
| CONTINUOUS | rna_seq_mrna_capture | data from Roche mRNA Capture Kit |
| Z-SCORE | rna_seq_mrna_capture_Zscores | data from Roche mRNA Capture Kit |
Example
An example metadata, e.g. meta_expression.txt file would be:
cancer_study_identifier: brca_tcga_pub
genetic_alteration_type: MRNA_EXPRESSION
datatype: CONTINUOUS
stable_id: rna_seq_mrna
show_profile_in_analysis_tab: false
profile_name: mRNA expression
profile_description: Expression levels
data_filename: data_expression.txt
Data file
For each gene (row) in the data file, the following columns are required in the order specified:
One or both of:
- Hugo_Symbol: A HUGO gene symbol.
- Entrez_Gene_Id: A Entrez Gene identifier.
And:
- An additional column for each sample in the dataset using the sample id as the column header.
For each gene-sample combination, a value is specified:
- A real number for each sample id (column) in the dataset, representing the expression value for the gene in the respective sample.
- or
NAfor when the expression value for the gene in the respective sample could not (or was not) be measured (or detected).
z-score instructions
For mRNA expression data, we typically expect the relative expression of an individual gene and tumor to the gene's expression distribution in a reference population. That reference population is either all tumors that are diploid for the gene in question, or, when available, normal adjacent tissue. The returned value indicates the number of standard deviations away from the mean of expression in the reference population (Z-score). This measure is useful to determine whether a gene is up- or down-regulated relative to the normal samples or all other tumor samples. Note, the importer tool can create normalized (z-score) expression data on your behalf. Please visit the Z-Score normalization script wiki page for more information. A corresponding z-score metadata file would be something like:
cancer_study_identifier: brca_tcga_pub
genetic_alteration_type: MRNA_EXPRESSION
datatype: Z-SCORE
stable_id: rna_seq_mrna_median_Zscores
show_profile_in_analysis_tab: true
profile_name: mRNA expression z-scores
profile_description: Expression levels z-scores
data_filename: data_expression_zscores.txt
Examples of data files:
An example data file which includes the required column header and leaves out Hugo_Symbol (recommended) would look like:
Entrez_Gene_Id<TAB>SAMPLE_ID_1<TAB>SAMPLE_ID_2<TAB>...
116983<TAB>-0.005<TAB>-0.550<TAB>...
375790<TAB>0.142<TAB>0.091<TAB>...
...
...
An example data file which includes both Hugo_Symbo and Entrez_Gene_Id would look like (supported, but not recommended as it increases the chances of errors regarding ambiguous gene symbols):
Hugo_Symbol<TAB>Entrez_Gene_Id<TAB>SAMPLE_ID_1<TAB>SAMPLE_ID_2<TAB>...
ACAP3<TAB>116983<TAB>-0.005<TAB>-0.550<TAB>...
AGRN<TAB>375790<TAB>0.142<TAB>0.091<TAB>...
...
...
An example data file with only Hugo_Symbol column (supported, but not recommended as it increases the chances of errors regarding ambiguous gene symbols):
Hugo_Symbol<TAB>SAMPLE_ID_1<TAB>SAMPLE_ID_2<TAB>...
ACAP3<TAB>-0.005<TAB>-0.550<TAB>...
AGRN<TAB>0.142<TAB>0.091<TAB>...
...
...
Mutation Data
When loading mutation data, the _sequenced case list is required. See the
Meta file
The mutation metadata file should contain the following fields:
- cancer_study_identifier: same value as specified in
study meta file - genetic_alteration_type: MUTATION_EXTENDED
- datatype: MAF
- stable_id: mutations
- show_profile_in_analysis_tab: true
- profile_name: A name for the mutation data, e.g., "Mutations".
- profile_description: A description of the mutation data, e.g., "Mutation data from whole exome sequencing.".
- data_filename: your data file
- gene_panel (optional): gene panel stable id. See
Gene panels for mutation data . - swissprot_identifier (optional):
accessionorname, indicating the type of identifier in theSWISSPROTcolumn - variant_classification_filter (optional): List of
Variant_Classificationsvalues to be filtered out. - namespaces (optional): Comma-delimited list of
namespacesto import.
Gene panels for mutation data
Using the gene_panel property it is possible to annotate all samples in the MAF file as being profiled on the same specified gene panel.
Please use the
- Data contains samples that are profiled but no mutations are called. Also please add these to the
_sequencedcase list. - Multiple gene panels are used to profile the samples in the MAF file.
Variant classification filter
The variant_classification_filter field can be used to filter out specific mutations. This field should contain a comma separated list of Variant_Classification values. By default, cBioPortal filters out Silent, Intron, IGR, 3'UTR, 5'UTR, 3'Flank and 5'Flank, except for the promoter mutations of the TERT gene. For no filtering, include this field in the metadata file, but leave it empty. For cBioPortal default filtering, do not include this field in the metadata file.
Allowed values to filter out (mainly from Mutation Annotation Format page): Frame_Shift_Del, Frame_Shift_Ins, In_Frame_Del, In_Frame_Ins, Missense_Mutation, Nonsense_Mutation, Silent, Splice_Site, Translation_Start_Site, Nonstop_Mutation, 3'UTR, 3'Flank, 5'UTR, 5'Flank, IGR, Intron, RNA, Targeted_Region, De_novo_Start_InFrame, De_novo_Start_OutOfFrame, Splice_Region and Unknown
Tumor seq allele ambiguity
Bugs may exist in MAF data that make it ambiguous as to whether Tumor_Seq_Allele1 or Tumor_Seq_Allele2 should be seen as the variant allele to be used when a new mutation record is created and imported in cBioPortal. In such cases, preference is given to the tumor seq allele value that matches a valid nucleotide pattern ^[ATGC]*$ versus a null or empty value, or "-".
For example, given Reference_Allele = "G", Tumor_Seq_Allele = "-", and Tumor_Seq_Allele2 = "A", preference will be given to Tumor_Seq_Allele2. Using this same example with Tumor_Seq_Allele1 = "T", preference will be given to Tumor_Seq_Allele1 if it does not match Reference_Allele, which in this case it does not.
When curating MAF data, it is best practice to leave Tumor_Seq_Allele1 empty if this information is not provided in your data source to avoid this ambiguity.
Namespaces
The namespaces field can be used to specify additional MAF columns for import. This field should contain a comma separated list of namespaces. Namespaces can be identified as prefixes to an arbitrary set of additional MAF columns (separated with a period e.g ASCN.total_copy_number, ASCN.minor_copy_number). All columns with a prefix matching a namespace specified in the metafile will be imported; columns with an unspecified namespace will be ignored. If no additional columns beyond the required set need to be imported, the field should be left blank.
Example
An example metadata file would be:
cancer_study_identifier: brca_tcga_pub
genetic_alteration_type: MUTATION_EXTENDED
datatype: MAF
stable_id: mutations
show_profile_in_analysis_tab: true
profile_description: Mutation data from whole exome sequencing.
profile_name: Mutations
data_filename: data_mutations.txt
namespaces: ASCN
Data file
The cBioPortal mutation data file extends the Mutation Annotation Format (MAF) created as part of The Cancer Genome Atlas (TCGA) project, by adding extra annotations to each mutation record. This section describes:
- How to create the cBioPortal mutation data file with a minimal MAF file using the Genome Nexus Annotation Pipeline.
- The description of the cBioPortal mutation data file. You can also get the cBioPortal mutation data file from vcf using: vcf2maf.
Create the cBioPortal mutation data file with Genome Nexus with a minimal MAF file
Minimal MAF file format
A minimal mutation annotations file can contain just the five genomic change columns plus one sample identifier column. From this minimal MAF, it is possible to create the cBioPortal mutation data file by running it through the Genome Nexus Annotation Pipeline.
- Chromosome (Required): A chromosome number, e.g., "7".
- Start_Position (Required): Start position of event.
- End_Position (Required): End position of event.
- Reference_Allele (Required): The plus strand reference allele at this position.
- Tumor_Seq_Allele2 (Required): Primary data genotype.
- Tumor_Sample_Barcode (Required): This is the sample ID. Either a TCGA barcode (patient identifier will be extracted), or for non-TCGA data, a literal SAMPLE_ID as listed in the clinical data file.
In addition to the above columns, it is recommended to have the read counts to calculate variant allele frequencies:
- t_alt_count (Optional, but recommended): Variant allele count (tumor).
- t_ref_count (Optional, but recommended): Reference allele count (tumor).
The following extra annotation columns are important for making sure mutation specific UI functionality works well in the portal:
- Protein_position (Optional): (annotation column) Required to initialize the 3D viewer in mutations view
- SWISSPROT (Optional): (annotation column) UniProtKB/SWISS-PROT name (formerly called ID) or accession code depending on the value of the
swissprot_identifiermetadatum, e.g. O11H1_HUMAN or Q8NG94. Is not required, but not having it may result in inconsistent PDB structure matching in mutations view.
Creating the cBioPortal mutation data file
Once you have a minimal MAF you can run it through the Genome Nexus Annotation Pipeline. This tool runs annotates variants against the Genome Nexus Server, which in turn leverages Ensembl Variant Effect Predictor (VEP) and selects a single effect per variant. Protein identifiers will be mapped to UniProt canonical isoforms (see also this mapping file).
cBioPortal mutation data file format
The cBioPortal mutation data file format recognized by the portal has:
- 32 columns from the TCGA MAF format.
- 1 column with the amino acid change.
- 4 columns with information on reference and variant allele counts in tumor and normal samples.
- Hugo_Symbol (Required): A HUGO gene symbol.
- Entrez_Gene_Id (Optional, but recommended): A Entrez Gene identifier.
- Center (Optional): The sequencing center.
- NCBI_Build (Required)1: The Genome Reference Consortium Build is used by a variant calling software. It must be "GRCh37" or "GRCh38" for a human, and "GRCm38" for a mouse.
- Chromosome (Required): A chromosome number, e.g., "7".
- Start_Position (Optional, but recommended for additional features such as Cancer Hotspots annotations): Start position of event.
- End_Position (Optional, but recommended for additional features such as Cancer Hotspots annotations): End position of event.
- Strand (Optional): We assume that the mutation is reported for the + strand.
- Variant_Classification (Required): Translational effect of variant allele, e.g. Missense_Mutation, Silent, etc.
- Variant_Type 1(Optional): Variant Type, e.g. SNP, DNP, etc.
- Reference_Allele (Required): The plus strand reference allele at this position.
- Tumor_Seq_Allele1 (Optional): Primary data genotype.
- Tumor_Seq_Allele2 (Required): Primary data genotype.
- dbSNP_RS1 (Optional): Latest dbSNP rs ID.
- dbSNP_Val_Status1 (Optional): dbSNP validation status.
- Tumor_Sample_Barcode (Required): This is the sample ID. Either a TCGA barcode (patient identifier will be extracted), or for non-TCGA data, a literal SAMPLE_ID as listed in the clinical data file.
- Matched_Norm_Sample_Barcode1 (Optional): The sample ID for the matched normal sample.
- Match_Norm_Seq_Allele1 (Optional): Primary data.
- Match_Norm_Seq_Allele2 (Optional): Primary data.
- Tumor_Validation_Allele1 (Optional): Secondary data from orthogonal technology.
- Tumor_Validation_Allele2 (Optional): Secondary data from orthogonal technology.
- Match_Norm_Validation_Allele11 (Optional): Secondary data from orthogonal technology.
- Match_Norm_Validation_Allele21 (Optional): Secondary data from orthogonal technology.
- Verification_Status1 (Optional): Second pass results from independent attempt using same methods as primary data source. "Verified", "Unknown" or "NA".
- Validation_Status (Optional): Second pass results from orthogonal technology. "Valid", "Invalid", "Untested", "Inconclusive", "Redacted", "Unknown" or "NA".
- Mutation_Status (Optional): "Somatic" or "Germline" are supported by the UI in Mutations tab. "None", "LOH" and "Wildtype" will not be loaded. Other values will be displayed as text.
- Sequencing_Phase1 (Optional): Indicates current sequencing phase.
- Sequence_Source1 (Optional): Molecular assay type used to produce the analytes used for sequencing.
- Validation_Method1 (Optional): The assay platforms used for the validation call.
- Score1 (Optional): Not used.
- BAM_File1 (Optional): Not used.
- Sequencer1 (Optional): Instrument used to produce primary data.
- HGVSp_Short (Required): Amino Acid Change, e.g. p.V600E.
- t_alt_count (Optional): Variant allele count (tumor).
- t_ref_count (Optional): Reference allele count (tumor).
- n_alt_count (Optional): Variant allele count (normal).
- n_ref_count (Optional): Reference allele count (normal).
1 These columns are currently not shown in the Mutation tab and Patient view.
Custom driver annotations
It is possible to manually add columns for defining custom driver annotations. These annotations can be used to complement or replace default driver annotation resources OncoKB and HotSpots.
- cbp_driver (Optional): "Putative_Driver", "Putative_Passenger", "Unknown", "NA" or "" (empty value). This field must be present if the cbp_driver_annotation is also present in the MAF file.
- cbp_driver_annotation (Optional): Description field for the cbp_driver value (limited to 80 characters). This field must be present if the cbp_driver is also present in the MAF file. This field is free text. Example values for this field are: "Pathogenic" or "VUS".
- cbp_driver_tiers (Optional): Free label/category that marks the mutation as a putative driver such as "Driver", "Highly actionable", "Potential drug target". . This field must be present if the cbp_driver_tiers_annotation is also present in the MAF file. In the OncoPrint view's Mutation Color dropdown menu, these tiers are ordered alphabetically. This field is free text and limited to 20 characters. For mutations without a custom annotation, leave the field blank or type "NA".
- cbp_driver_tiers_annotation (Optional): Description field for the cbp_driver_tiers value (limited to 80 characters). This field must be present if the cbp_driver_tiers is also present in the MAF file. This field can not be present when the cbp_driver_tiers field is not present.
The cbp_driver column flags the mutation as either driver or passenger. In cBioPortal, passenger mutations are also known as variants of unknown significance (VUS). The cbp_driver_tiers column assigns an annotation tier to the mutation, such as "Driver", "Highly actionable" or "Potential drug target". When a tier is selected, mutations with that annotation are highlighted as driver. Both types of custom annotations contain a second column with the suffix _annotation, to add a description. This is displayed in the tooltip that appears when hovering over the sample's custom annotation icon in the OncoPrint view.
You can learn more about configuring these annotations in the application.properties documentation. When properly configured, the customized annotations appear in the "Mutation Color" menu of the OncoPrint view:
Adding your own mutation annotation columns
Additional mutation annotation columns can be added to the cBioPortal mutation data file. In this way, the portal will parse and store your own MAF fields in the database. For example, mutation data that you find on cBioPortal.org comes from MAF files that have been further enriched with information from mutationassessor.org, which leads to a "Mutation Assessor" column in the mutation table.
See
Allele specific copy number (ASCN) annotations
Allele specific copy number (ASCN) annotation is also supported and may be added using namespaces, described
The ASCN columns below are optional by default. If ascn is a defined namespace in meta_mutations_extended.txt, then these columns are ALL required.
- ASCN.ASCN_METHOD (Optional): Method used to obtain ASCN data e.g "FACETS".
- ASCN.CCF_EXPECTED_COPIES (Optional): Cancer-cell fraction if mutation exists on major allele. Displayed as a plain number for single-sample patients or as a bar chart for multi-sample patients in the patient view mutation table.
- ASCN.CCF_EXPECTED_COPIES_UPPER (Optional): Upper error for CCF estimate.
- ASCN.EXPECTED_ALT_COPIES (Optional): Estimated number of copies harboring mutant allele.
- ASCN.CLONAL (Optional): "Clonal", "Subclonal", or "Indeterminate". Displayed as a "Clonal" boolean column in the patient view mutation table, where only "Clonal" values are indicated with a dot.
- ASCN.TOTAL_COPY_NUMBER (Optional): Total copy number of the gene.
- ASCN.MINOR_COPY_NUMBER (Optional): Copy number of the minor allele.
- ASCN.ASCN_INTEGER_COPY_NUMER (Optional): Absolute integer copy-number estimate.
Example cBioPortal mutation data file
An example cBioPortal mutation data file can be found in the cBioPortal test study study_es_0.
Filtered mutations
A special case for Entrez_Gene_Id=0 and Hugo_Symbol=Unknown: when this combination is given, the record is parsed in the same way as Variant_Classification=IGR and therefore filtered out.
Methylation Data
The Portal expects a single value for each gene in each sample, usually a beta-value from the Infinium methylation array platform.
Meta file
The methylation metadata file should contain the following fields:
- cancer_study_identifier: same value as specified in
study meta file - genetic_alteration_type: METHYLATION
- datatype: CONTINUOUS
- stable_id: "methylation_hm27" or "methylation_hm450" (depending on platform).
- show_profile_in_analysis_tab: false
- profile_name: A name for the methylation data, e.g., "Methlytation (HM27)".
- profile_description: A description of the methlytation data, e.g., "Methylation beta-values (HM27 platform). For genes with multiple methylation probes, the probe least correlated with expression is selected.".
- data_filename: your datafile
- gene_panel (Optional): gene panel stable id
Example
An example metadata file would be:
cancer_study_identifier: brca_tcga_pub
genetic_alteration_type: METHYLATION
datatype: CONTINUOUS
stable_id: methylation_hm27
show_profile_in_analysis_tab: false
profile_name: Methylation (HM27)
profile_description: Methylation beta-values (HM27 platform). For genes with multiple methylation probes, the probe least correlated with expression is selected.
data_filename: data_methylation_hm27.txt
Data file
The methylation data file follows the same format as expression data files. See
Protein level Data
Protein expression measured by reverse-phase protein array or mass spectrometry. Antibody-sample pairs, with a real number representing the protein level for that sample.
Meta file
The protein level metadata file should contain the following fields:
- cancer_study_identifier: same value as specified in
study meta file - genetic_alteration_type: PROTEIN_LEVEL
- datatype: LOG2-VALUE or Z-SCORE
- stable_id: rppa, rppa_Zscores, protein_quantification or protein_quantification_zscores
- show_profile_in_analysis_tab: false (true for Z-SCORE datatype)
- profile_name: A name for the RPPA data, e.g., "RPPA data".
- profile_description: A description of the RPPA data, e.g., "RPPA levels.".
- data_filename: your datafile
- gene_panel (Optional): gene panel stable id
An example metadata file would be:
cancer_study_identifier: brca_tcga
genetic_alteration_type: PROTEIN_LEVEL
datatype: LOG2-VALUE
stable_id: rppa
show_profile_in_analysis_tab: false
profile_description: Protein expression measured by reverse-phase protein array
profile_name: Protein expression (RPPA)
data_filename: data_rppa.txt
NB: You also need a Z-SCORE file if you want protein levels to be available in query UI and in Oncoprint visualization. E.g.:
cancer_study_identifier: brca_tcga
genetic_alteration_type: PROTEIN_LEVEL
datatype: Z-SCORE
data_filename: data_rppa_zscores.txt
stable_id: rppa_Zscores
show_profile_in_analysis_tab: true
profile_description: Protein expression Z-scores (RPPA)
profile_name: Protein expression Z-scores (RPPA)
Data file
A protein level data file is a two dimensional matrix with a RPPA antibody per row and a sample per column. For each antibody-sample pair, a real number represents the protein level for that sample. The antibody information can contain one or more HUGO gene symbols and/or entrez gene identifiers, separated by a space, and an antibody ID pair separated by the "|" symbol.
Example
An example data file which includes the required column header would look like:
Composite.Element.REF<TAB>SAMPLE_ID_1<TAB>SAMPLE_ID_2<TAB>...
BRAF|B-Raf-M-NA<TAB>1.09506676325<TAB>0.5843256495...
MAPK1 MAPK3|MAPK_PT202_Y204<TAB>1.70444582025<TAB>1.0982864685...
AKT1 AKT2 10000|AKT<TAB>0.17071492725<TAB>0.264067254391
...
Structural Variant Data
The cBioPortal can load all kinds of structural variant data but at the moment only a subset of them, fusions, are displayed.
Meta file
The structural variant metadata file should contain the following fields:
- cancer_study_identifier: same value as specified in
study meta file - genetic_alteration_type: STRUCTURAL_VARIANT
- datatype: SV
- stable_id: structural_variants
- show_profile_in_analysis_tab: true.
- profile_name: A name for the fusion data, e.g., "Structural Variants".
- profile_description: A description of the structural variant data.
- data_filename: your datafile (e.g. data_sv.txt)
- gene_panel (Optional): gene panel stable id
An example metadata file would be:
cancer_study_identifier: msk_impact_2017
genetic_alteration_type: STRUCTURAL_VARIANT
datatype: SV
stable_id: structural_variants
show_profile_in_analysis_tab: true
profile_name: Structural variants
profile_description: Structural Variant Data for mskimpact2017
data_filename: data_sv.txt
Data file
A structural variant data file is a tab-delimited file with one structural variant per row. For each structural variant (row) in the data file, the following tab-delimited values are required:
For an example see datahub. For an example see datahub. At a minimum Sample_Id, either Site1_Hugo_Symbol/ Site1_Entrez_Gene_Id or Site2_Hugo_Symbol/ Site2_Entrez_Gene_Id and SV_Status are required. For the stuctural variant tab visualization (still in development) one needs to provide those field as well as Site1_Ensembl_Transcript_Id, Site2_Ensembl_Transcript_Id, Site1_Region and Site2_Region. Some of the other columns are shown at several other pages on the website. The Class, Annotation and Event_Info columns are shown prominently on several locations.
Note: We strongly recommend all the data providers to submit genomic locations in addition to required fields for future visualization features.
Adding your own structural variant columns
Additional mutation annotation columns can be added to the structural variant data file. In this way, the portal will parse and store your own structural variant fields in the database.
See
Fusion Data
⚠️ DEPRECATED Use the:
Meta file
The fusion metadata file should contain the following fields:
- cancer_study_identifier: same value as specified in
study meta file - genetic_alteration_type: FUSION
- datatype: FUSION
- stable_id: fusion
- show_profile_in_analysis_tab: true.
- profile_name: A name for the fusion data, e.g., "Fusions".
- profile_description: A description of the fusion data.
- data_filename: your datafile
- gene_panel (Optional): gene panel stable id
Example
An example metadata file would be:
cancer_study_identifier: brca_tcga_pub
genetic_alteration_type: FUSION
datatype: FUSION
stable_id: fusion
show_profile_in_analysis_tab: true
profile_name: Fusions
profile_description: Fusion data.
data_filename: data_fusions.txt
Data file
A fusion data file is a two dimensional matrix with one gene per row. For each gene (row) in the data file, the following tab-delimited values are required in the order specified:
- Hugo_Symbol: A HUGO gene symbol.
- Entrez_Gene_Id: A Entrez Gene identifier.
- Center: The sequencing center.
- Tumor_Sample_Barcode: This is the sample ID.
- Fusion: A description of the fusion, e.g., "TMPRSS2-ERG fusion".
- DNA_support: Fusion detected from DNA sequence data, "yes" or "no".
- RNA_support: Fusion detected from RNA sequence data, "yes" or "no".
- Method: Fusion detected algorithm/tool.
- Frame: "in-frame" or "frameshift".
- Fusion_Status (OPTIONAL): An assessment of the mutation type (i.e., "SOMATIC", "GERMLINE", "UNKNOWN", or empty)
Note: If a fusion event includes a gene, e.g., Hugo_Symbol or Entrez_Gene_Id, that is not profiled, the event will be filter out during import into the database.
An example data file which includes the required column header would look like:
Hugo_Symbol<TAB>Entrez_Gene_Id<TAB>Center<TAB>Tumor_Sample_Barcode<TAB>Fusion<TAB>DNA_support<TAB>RNA_support<TAB>Method<TAB>Frame>
ALK<TAB>238<TAB>center.edu<TAB>SAMPLE_ID_1<TAB>Fusion<TAB>unknown<TAB>yes<TAB>unknown<TAB>in-frame
ALK<TAB>238<TAB>center.edu<TAB>SAMPLE_ID_2<TAB>Fusion<TAB>unknown<TAB>yes<TAB>unknown<TAB>in-frame
RET<TAB>5979<TAB>center.edu<TAB>SAMPLE_ID_3<TAB>Fusion<TAB>unknown<TAB>yes<TAB>unknown<TAB>in-frame
...
...
Case Lists
Case lists are used to define sample lists that can be selected on the query page. Some case lists have specific functionality, but it's also possible to add custom case lists. The case list files should be placed in a sub-directory called case_lists which exists alongside all the other cancer study data.
The case list file should contain the following fields:
- cancer_study_identifier: same value as specified in
study meta file - stable_id: it must contain the cancer_study_identifier followed by an underscore. Typically, after this a relevant suffix, e.g.,
_custom, is added. There are some naming rules to follow if you want the case list to be selected automatically in the query UI base on the selected sample profiles. See subsection below. - case_list_name: A name for the patient list, e.g., "All Tumors".
- case_list_description: A description of the patient list, e.g., "All tumor samples (825 samples).".
- case_list_ids: A tab-delimited list of sample ids from the dataset.
- case_list_category: Optional alternative way of linking your case list to a specific molecular profile. E.g. setting this to
all_cases_with_cna_datawill signal to the portal that this is the list of samples to be associated with CNA data in some of the analysis.
Example
An example case list file would be:
cancer_study_identifier: brca_tcga_pub
stable_id: brca_tcga_pub_custom
case_list_name: Custom subset of samples
case_list_description: Custom subset of samples (825 samples)
case_list_ids: SAMPLE_ID_1<TAB>SAMPLE_ID_2<TAB>SAMPLE_ID_3<TAB>...
Case list stable id suffixes
In order for sample counts to propagate to the data sets widget on the home page and the table on the Data Sets page, the following case list suffixes need to be used in the stable_id property (e.g. brca_tcga_pub_sequenced). This is also needed for correct statistics in the Study view page when calculating the frequency of CNA and of mutations per gene in the respective summary tables.
- Sequenced:
_sequenced. When only a mutation profile is selected on the query page, this is the default case list. Also used in the Study Summary to calculate the proportion of samples with mutations. - CNA:
_cna. When only a CNA profile is selected on the query page, this is the default case list. Also used in the Study Summary to calculate the proportion of samples with CNA. - Sequenced and CNA:
_cnaseq. When a mutation and CNA genetic profile are selected on the query page, this is the default case list. - mRNA (microarray):
_mrna. When only a mRNA (microarray) profile is selected on the query page, this is the default case list. - mRNA (RNA-Seq):
_rna_seq_mrna. When only a mRNA (RNA-Seq) profile is selected on the query page, this is the default case list. - mRNA (RNA-SeqV2):
_rna_seq_v2_mrna. When only a mRNA (RNA-SeqV2) profile is selected on the query page, this is the default case list. - mRNA normal:
_normal_mrna. Used for the datasets page to calculate the number of normal samples. - mRNA normal:
_microrna. Used for the datasets page to calculate the number of microRNA samples. - Methylation (HM27):
_methylation_hm27. - RPPA:
_rppa. When only a RPPA profile is selected on the query page, this is the default case list. - Sequenced, CNA and mRNA:
_3way_completeWhen a mutation, CNA and mRNA profile are selected on the query page, this is the default case list. - SV:
_sv. When a structural variant profile is selected on the query page, this is the default case list. Also used in the Study Summary to calculate the proportion of samples with fusions. - All:
_all. If you are not using add_global_case_list attribute inStudy metadata , you need to add this case list.
Required case lists
Some case lists are required:
_all. This can be generated by the importer if you set the attributeadd_global_case_listtotruein theStudy metadata ._sequenced. This case list is required when loading mutation data._cna. This case list is required when loading discrete cna data.
Case list categories
These are the valid case lists categories for case_list_category: in the meta file.
all_cases_in_studyall_cases_with_mutation_dataall_cases_with_cna_dataall_cases_with_log2_cna_dataall_cases_with_methylation_dataall_cases_with_mrna_array_dataall_cases_with_mrna_rnaseq_dataall_cases_with_rppa_dataall_cases_with_microrna_dataall_cases_with_mutation_and_cna_dataall_cases_with_mutation_and_cna_and_mrna_dataall_cases_with_gsva_dataall_cases_with_sv_dataother
Timeline Data
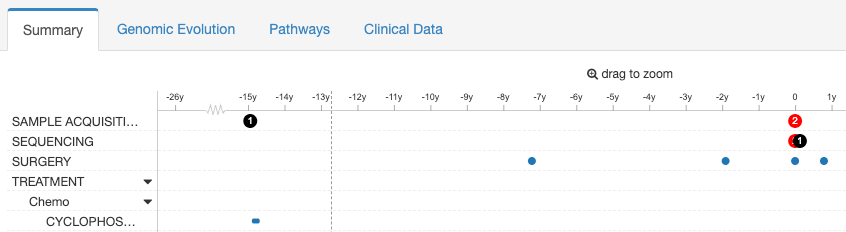
The timeline data is a representation of the various events that occur during the course of treatment for a patient from initial diagnosis. In cBioPortal timeline data is represented as one or more tracks in the patient view. Each main track is based on an event type, such as "Specimen", "Imaging", "Lab_test", etc.
Attention: some clinical attributes affect the timeline visualization. Please check the
This type data is not yet being validated. It can, however, be uploaded.
Meta file
Each event type requires its own meta file. A timeline meta file should contain the following fields:
- cancer_study_identifier: same value as specified in
study meta file - genetic_alteration_type: CLINICAL
- datatype: TIMELINE
- data_filename: your datafile
An example metadata file would be:
cancer_study_identifier: brca_tcga
genetic_alteration_type: CLINICAL
datatype: TIMELINE
data_filename: data_timeline_imaging.txt
Data file
Each event type requires its own data file, which contains all the events that each patient undergoes. The data format used for timeline data is extremely flexible. There are four required columns:
- PATIENT_ID: the patient ID from the dataset
- START_DATE: the start point of any event, calculated in *days from the date of diagnosis (which will act as point zero on the timeline scale)
- STOP_DATE: The end date of the event is calculated in days from the date of diagnosis (which will act as point zero on the timeline scale). If the event occurs over time (e.g. a Treatment, ...) the STOP_DATE column should have values. If the event occurs at a time point (e.g. a Lab_test, Imaging, ...) the STOP_DATE is still mandatory, but the values should be blanks.
- EVENT_TYPE: the category of the event. You are free to define any type of event here. For several event types cBioPortal has column naming suggestions and for several events there are column names which have special effects. See
event types for more information.
And optional columns with special effects:
- SPECIMEN_REFERENCE_NUMBER: SPECIMEN_REFERENCE_NUMBER is no longer supported. Please replace this column header with SAMPLE_ID.
- STYLE_SHAPE: when this column has a valid value, this event will be rendered using that shape. The valid shapes are
circle,square,triangle,diamond,star, andcamera. - STYLE_COLOR: when this column has a hexadecimal color value (e.g. #ffffff), it will be used as the color for rendering this event.
To embed hyperlinks in custom columns:
Values in custom columns can include markdown for hyperlinks that will show up in event tooltips, allowing users to click through to external resources associated with events.
Example column:
SOME_HYPERLINK: [Link text Here](https://link-url-here.org)
The external link can be opened in a new tab, instead of an IFRAME within the same window/tab. To do this, the string :blank is to be added as a suffix at the end of the URL.
HYPERLINK_OPEN_IN_NEWTAB: [Link text Here](https://link-url-here.org/path:blank)
Event Types
As previously mentioned, the EVENT_TYPE can be anything. However, several event types have columns with special effects. Furthermore, for some event types cBioPortal has column naming suggestions.
EVENT_TYPE: TREATMENT
Suggested columns
- TREATMENT_TYPE: This can be either Medical Therapy or Radiation Therapy.
- SUBTYPE: Depending upon the TREATMENT_TYPE, this can either be Chemotherapy, Hormone Therapy, Targeted Therapy etc. (for Medical Therapies) or WPRT, IVRT etc. (for Radiation Therapies).
- AGENT: for medical therapies, the agent is defined with number of cycles if applicable and for radiation therapy, the agent is defined as standard dose given to the patient during the course.
- AGENT_CLASS: This allows you to classify your agents into useful groups.
- Based on different cancer types you can add additional data here.
Special: When using the AGENT and SUBTYPE columns, each agent and subtype will be split into its own track.
EVENT_TYPE: LAB_TEST
Suggested columns
- TEST: type of test performed
- RESULT: corresponding value of the test
- Based on different cancer types you can add additional data here.
Special: When using the TEST and RESULT columns, each test gets its own track. Any TEST that has only numerical RESULT values will be rendered as a line chart.
EVENT_TYPE: IMAGING
Suggested columns
- DIAGNOSTIC_TYPE: This attribute will cover the different diagnostics tools used (for example: MRI, CT scan etc.)
- DIAGNOSTIC_TYPE_DETAILED: Detailed description of the event type.
- RESULT: Results of the diagnostic tests
- SOURCE: Where was the Imaging done.
- Based on different cancer types you can add additional data here.
Special: all dots in the IMAGING track are squares.
EVENT_TYPE: STATUS
Suggested columns
- STATUS: If the EVENT_TYPE is status, data is entered under STATUS to define either the best response from the treatment or if there is a diagnosis of any stage progression etc.
- SOURCE: Where the status was monitored.
- Based on different cancer types you can add additional data here.
EVENT_TYPE: SPECIMEN | SAMPLE ACQUISITION | SEQUENCING
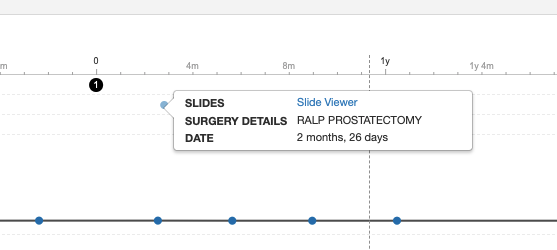
Events of type SPECIMEN, SAMPLE ACQUISITION or SEQUENCING are rendered as numbered discs and their tracks placed at the top of the timeline. They are color coded according to the sample's clinical data: the sample must have a clinical attribute of type "SAMPLE_TYPE" and value as follows:
- If set to
recurrence,recurred,progressionorprogressed: orange - If set to
metastaticormetastasis: red - If set to
primaryor otherwise: black
Suggested columns
- SPECIMEN_SITE: This is the site from where the specimen was collected.
- SPECIMEN_TYPE: This can either be tissue or blood.
- SOURCE: Where was the specimen collection done.
- Based on different cancer types you can add additional data here.
Clinical Track Ordering
Clinical tracks are ordered as follows (if available):
- Specimen
- Surgery
- Status
- Diagnostics
- Diagnostic
- Imaging
- Lab_test
- Treatment
- First custom event
- etc.
Example
An example timeline file for SPECIMEN would be:
PATIENT_ID<TAB>START_DATE<TAB>EVENT_TYPE<TAB>SAMPLE_ID<TAB>SPECIMEN_SITE<TAB>SPECIMEN_TYPE<TAB>SOURCE<TAB>MyCustomColumn
CACO2<TAB>0<TAB>SPECIMEN<TAB>CACO2_S1<TAB>liver<TAB>tissue<TAB>hospital<TAB>T1
CACO2<TAB>100<TAB>SPECIMEN<TAB>CACO2_S2<TAB>lung<TAB>tissue<TAB>hospital<TAB>T2
...
Assuming the sample identifiers were also defined in the clinical file, this will lead to a timeline track with numbered specimen samples.
An example timeline file for Lab_test would be:
PATIENT_ID<TAB>START_DATE<TAB>EVENT_TYPE<TAB>TEST<TAB>RESULT
CACO2<TAB>100<TAB>LAB_TEST<TAB>PSA<TAB>10
CACO2<TAB>250<TAB>LAB_TEST<TAB>PSA<TAB>100
...
This will lead to a timeline track for Lab_test with an additional subtrack specifically for PSA. PSA's events will be sized based on the result.
GISTIC 2.0 Data
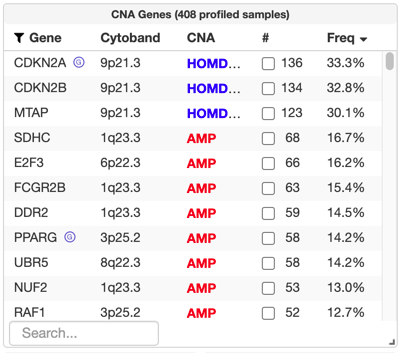
Running GISTIC 2.0 on e.g. GenePattern not only provides the
After uploading a gistic_amp and/or gistic_del file, significantly recurrently copy-number altered genes will be labeled and available for query in the "CNA Genes" table on the study view, like in the TCGA Legacy / Firehose data set for bladder cancer:
Meta file
The Gistic metadata file should contain the following fields:
- cancer_study_identifier: same value as specified in
study meta file - genetic_alteration_type: GISTIC_GENES_AMP or GISTIC_GENES_DEL
- datatype: Q-VALUE
- reference_genome_id: reference genome version. Supported values: "hg19"
- data_filename: your datafile
An example metadata file would be:
cancer_study_identifier: brca_tcga
genetic_alteration_type: GISTIC_GENES_AMP
datatype: Q-VALUE
reference_genome_id: hg19
data_filename: data_gistic_genes_amp.txt
Data file
The following fields from the generated Gistic file are used by the cBioPortal importer:
- chromosome: chromosome on which the region was found, without the
chrprefix - peak_start: start coordinate of the region of maximal amplification or deletion within the significant region
- peak_end: end coordinate of the region of maximal amplification or deletion within the significant region
- genes_in_region: comma-separated list of HUGO gene symbols in the 'wide peak' (allowing for single-sample errors in the peak boundaries)
- amp: 1 for amp, 0 for del
- cytoband: cytogenetic band specification of the region, including chromosome (Giemsa stain)
- q_value: the q-value of the peak region
Example
An example data file which includes the required column header would look like:
chromosome<TAB>peak_start<TAB>peak_end<TAB>genes_in_region<TAB>amp<TAB>cytoband<TAB>q_value<TAB>
1<TAB>150563314<TAB>150621176<TAB>SNORA40|ENSG00000253047.1,RN7SL600P,RN7SL473P,C1orf138,LINC00568,CTSS,ECM1,ENSA,MCL1,RPRD2,ADAMTSL4,GOLPH3L,TARS2,HORMAD1,MIR4257,<TAB>1<TAB>1q21.3<TAB>2.7818E-43<TAB>
1<TAB>85988564<TAB>85991712<TAB>DDAH1,<TAB>1<TAB>1p22.3<TAB>4.1251E-13<TAB>
...
MutSig Data
MutSig stands for "Mutation Significance". MutSig analyzes lists of mutations discovered in DNA sequencing, to identify genes that were mutated more often than expected by chance given background mutation processes. You can download mutsig from broadinstitute (MutSigCV 1.4 is available) or run mutsig (MutSigCV 1.2 is available) using GenePattern.
Note: The tcga files that are uploaded to cBioPortal are generated using MutSig2.0. This version is not available outside broadinstitute.
The MutSigCV 1.2 output is different from the MutSig2.0 header. TODO: test the 1.4 version. Requires > 10GB of memory
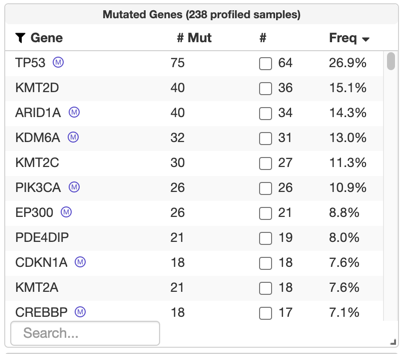
After uploading a MutSig file, significantly recurrently mutated genes will be labeled and available for query in the "Mutated Genes" table on the study view, like in the TCGA Legacy / Firehose data set for bladder cancer:
This type data is not yet being validated. It can, however, be uploaded.
Meta file
The MutSig metadata file should contain the following fields:
- cancer_study_identifier: same value as specified in
study meta file - genetic_alteration_type: MUTSIG
- datatype: Q-VALUE
- data_filename: your datafile
An example metadata file would be:
cancer_study_identifier: brca_tcga
genetic_alteration_type: MUTSIG
datatype: Q-VALUE
data_filename: data_mutsig.txt
Data file
The following fields from a MutSig file are used by the cBioPortal importer:
- rank
- gene: this is the HUGO symbol
- N (or Nnon): bases covered
- n (or nnon): number of mutations
- p: result of testing the hypothesis that all of the observed mutations in this gene are a consequence of random background mutation processes, taking into account the list of bases that are successfully interrogated by sequencing (i.e., “covered”) and the list of observed somatic mutations, as well as the length and composition of the gene in addition to the background mutation rates in different sequence contexts (https://www.ncbi.nlm.nih.gov/pmc/articles/PMC3059829/)
- q: p value correct for multiple testing
Example
An example data file which includes the required column header would look like:
rank<TAB>gene<TAB>N<TAB>n<TAB>p<TAB>q
1<TAB>RUNX1<TAB>1051659<TAB>29<TAB>1.11E-16<TAB>1.88E-12
2<TAB>PIK3CA<TAB>3200341<TAB>351<TAB><1.00e-15<TAB><2.36e-12
...
Gene Panel Data
Gene panel functionality can specify which genes are assayed on a panel and assign samples and genetic profiles (such as mutation data) to a panel.
To include gene panel data in your instance, the following data and/or configurations can be used:
- Gene panel file: This file contains the genes on the gene panel. A panel can be used for multiple studies within the instance and should be loaded prior to loading a study with gene panel data. For information on the format and import process please visit: Import-Gene-Panels.
- Gene panel matrix file: This file is used to specify which samples are sequenced on which gene panel in which genetic profile. This is recommended for mutation and structural variant data, because the MAF and structural variant formats are unable to include samples which are sequenced but contain no called mutations, and only a single gene panel can be defined in the meta file. For other genetic profiles, columns can be added to specify their gene panel, but a property can also be added to their respective meta file, because these data files contain all profiled samples. Although the gene panel matrix functionality overlaps with the case list functionality, a case list for mutations (
_sequenced) and Structural variants (_sv) is also required. - Gene panel property in meta file: Adding the
gene_panel:property to the meta file of data profile will assign all samples from that profile to the gene panel. In this case it is not necessary to include a column for this profile in the gene panel matrix file.
Gene Panel Matrix file
Columns and rows
The gene panel matrix file contains a list of samples in the first column, and an additional column for each profile in the study using the stable_id as the column header. These stable_id's should match the ones in their respective meta files, for example mutations for mutation data and gistic for discrete CNA data. Columns should be separated by tabs. Fusion events are saved in the mutation table in the cBioPortal database, so they should be included in the mutations column. As described above, genetic profiles other than mutation and fusion data profiles can use the gene_panel: meta property if all samples are profiled on the same gene panel.
Values
For each sample-profile combination, a gene panel should be specified. Please make sure this gene panel is imported before loading the study data. When the sample is not profiled on a gene panel, or if the sample is not profiled at all, use NA as value. If the sample is profiled for mutations, make sure it is also in the _sequenced case list.
Example
An example file would look like this:
Meta file
The gene panel matrix file requires a meta file, which should contain the following fields:
- cancer_study_identifier: same value as specified in
study meta file - genetic_alteration_type: GENE_PANEL_MATRIX
- datatype: GENE_PANEL_MATRIX
- data_filename: your datafile
Example:
cancer_study_identifier: msk_impact_2017
genetic_alteration_type: GENE_PANEL_MATRIX
datatype: GENE_PANEL_MATRIX
data_filename: data_gene_panel_matrix.txt
Gene panel property in meta file
If all samples in a genetic profile have the same gene panel associated with them, an optional field can be specified in the meta data file of that datatype called gene_panel:. If this is present, all samples in this data file will be assigned to this gene panel for this specific profile.
Gene Set Data
A description of importing gene sets (which are required before loading gene set study) can be found here. This page also contains a decription to import gene set hierarchy data, which is required to show a hierarchical tree on the query page to select gene sets.
cBioPortal supports GSVA scores and GSVA-like scores, such as ssGSEA. The Gene Set Variation Analysis method in R (GSVA, Hänzelmann, 2013) can calculate several types of scores (specified with the methods= argument) and outputs a score between -1 and 1. The GSVA method also calculates a p-value per score using a bootstrapping method.
To import the GSVA(-like) data, a score and p-value data file are required. It is important that the dimensions of the score and p-value file are the same and that they contain the same gene sets and samples. Both data files require a meta file.
GSVA score meta file
The meta file will be similar to meta files of other genetic profiles, such as mRNA expression. For both GSVA and GSVA-like scores, GSVA-SCORE is used as datatype and gsva_scores is used as stable_id.
Required fields:
cancer_study_identifier: Same value as specified in study meta file
genetic_alteration_type: GENESET_SCORE
datatype: GSVA-SCORE
stable_id: Any unique identifier within the study
source_stable_id: Stable id of the genetic profile (in this same study) that was used as the input source for calculating the GSVA scores. Typically this will be one of the mRNA expression genetic profiles.
profile_name: A name describing the analysis.
profile_description: A description of the data processing done.
data_filename: <your GSVA score datafile>
show_profile_in_analysis_tab: true
geneset_def_version: Version of the gene set definition this calculation was based on.
Example:
cancer_study_identifier: study_es_0
genetic_alteration_type: GENESET_SCORE
datatype: GSVA-SCORE
stable_id: gsva_scores
source_stable_id: rna_seq_mrna
profile_name: GSVA scores on oncogenic signatures gene sets
profile_description: GSVA scores on oncogenic signatures gene sets using mRNA expression data calculated with GSVA version x with parameters x and y.
data_filename: data_gsva_scores.txt
show_profile_in_analysis_tab: true
geneset_def_version: msigdb_7.5.1
GSVA score data file
The data file will be a simple tab separated format, similar to the expression data file: each sample is a column, each gene set a row, each cell contains the GSVA score for that sample x gene set combination.
The first column is geneset_id and contains the names of the gene sets. Gene set names should be formatted in uppercase. The other columns are sample columns: An additional column for each sample in the dataset using the sample id as the column header.
The cells contain the GSVA(-like) score: which is real number, between -1.0 and 1.0, representing the score for the gene set in the respective sample, or NA when the score for the gene set in the respective sample could not be (or was not) calculated. Example with 2 gene sets and 3 samples:
| geneset_id | TCGA-AO-A0J | TCGA-A2-A0Y | TCGA-A2-A0S |
|---|---|---|---|
| GO_POTASSIUM_ION_TRANSPORT | -0.987 | 0.423 | -0.879 |
| GO_GLUCURONATE_METABOLIC_PROCES | 0.546 | 0.654 | 0.123 |
| .. |
GSVA p-value meta file
For both GSVA and GSVA-like p-values, P-VALUE is used as datatype and gsva_pvalues is used as stable_id.
Required fields:
cancer_study_identifier: Same value as specified in study meta file
genetic_alteration_type: GENESET_SCORE
datatype: P-VALUE
stable_id: Any unique identifier within the study
source_stable_id: Stable id of the GSVA-SCORE genetic profile (see above).
profile_name: A name describing the analysis.
profile_description: A description of the data processing done.
data_filename: <your GSVA p-value datafile>
geneset_def_version: Version of the gene sets definition this calculation was based on.
Example:
cancer_study_identifier: study_es_0
genetic_alteration_type: GENESET_SCORE
datatype: P-VALUE
stable_id: gsva_pvalues
source_stable_id: gsva_scores
profile_name: GSVA p-values for GSVA scores on oncogenic signatures gene sets
profile_description: GSVA p-values for GSVA scores on oncogenic signatures gene sets using mRNA expression data calculated with the bootstrapping method in GSVA version x with parameters x and y.
data_filename: data_gsva_pvalues.txt
geneset_def_version: msigdb_7.5.1
GSVA p-value data file
The data file will be a simple tab separated format, similar to the score file: each sample is a column, each gene set a row, each cell contains the p-value for the score found for sample x gene set combination.
The first column is geneset_id and contains the names of the gene sets. Gene set names should be formatted in uppercase. The other columns are sample columns: An additional column for each sample in the dataset using the sample id as the column header.
The cells contain the p-value for the GSVA score: A real number, between 0.0 and 1.0, representing the p-value for the GSVA score calculated for the gene set in the respective sample, or NA when the score for the gene is also NA. Example with 2 gene sets and 3 samples:
| geneset_id | TCGA-AO-A0J | TCGA-A2-A0Y | TCGA-A2-A0S |
|---|---|---|---|
| GO_POTASSIUM_ION_TRANSPORT | 0.0811 | 0.0431 | 0.0087 |
| GO_GLUCURONATE_METABOLIC_PROCES | 0.6621 | 0.0031 | 1.52e-9 |
| .. |
Study Tags file
YAML or JSON file which contains extra information about the cancer study. No compulsory fields are required for this file (free-form). To enable this feature, you need to add a line in the cancer study meta file with tags_file: followed the YAML/JSON file name. The information on the YAML or JSON file will be displayed in a table when mousing over a tag logo in the studies on the query page.
Generic Assay
Generic Assay is a two dimensional matrix generalized to capture non-genetic measurements per sample. Instead of a gene per row and a sample per column, a Generic Assay file contains a generic entity per row and a sample per column. A generic entity is defined by the data curator and generally means something other than a gene. Some examples include, treatment response or mutational signatures. For each generic entity - sample pair, a (real number / text / binary value) represents a captured measurement.
Generic Assay meta file
The generic assay metadata file should contain the following fields:
cancer_study_identifier: Same value as specified in meta file of the study
genetic_alteration_type: GENERIC_ASSAY
generic_assay_type: <GENERIC_ASSAY_TYPE>, e.g., "TREATMENT_RESPONSE" or "MUTATIONAL_SIGNATURE"
datatype: LIMIT-VALUE, CATEGORICAL or BINARY
stable_id: Any unique identifier using a combination of alphanumeric characters, _ and -
profile_name: A name describing the analysis.
profile_description: A description of the data processing done.
data_filename: <name of generic assay data file>
show_profile_in_analysis_tab: true (or false if you don't want to show this profile in any analysis tab)
pivot_threshold_value: A threshold value beyond which a generic assay data is considered effective
value_sort_order: A flag that determines whether samples with small generic assay data values are displayed first or last; can be 'ASC' for small first, 'DESC' for small last.
patient_level: false (or true if your data is patient level data)
generic_entity_meta_properties: A comma separate list of generic entity properties, e.g., "NAME,DESCRIPTION,URL"
Example:
cancer_study_identifier: study_es_0
genetic_alteration_type: GENERIC_ASSAY
generic_assay_type: TREATMENT_RESPONSE
datatype: LIMIT-VALUE
stable_id: treatment_ic50
profile_name: IC50 values of compounds on cellular phenotype readout
profile_description: IC50 (compound concentration resulting in half maximal inhibition) of compounds on cellular phenotype readout of cultured mutant cell lines.
data_filename: data_treatment_ic50.txt
show_profile_in_analysis_tab: true
pivot_threshold_value: 0.1
value_sort_order: ASC
patient_level: false
generic_entity_meta_properties: NAME,DESCRIPTION,URL
Note on stable_id
The stable_id for the generic assay datatype is a user defined field. The only requirement is that the stable_id is unique across all metafiles in the study.
Note on pivot_threshold_value
The pivot_threshold_value is an arbitrary value that specifies a critical boundary that distinguish important from
unimportant values in a generic assay profile. This boundary will be used in different visualizations to highlight
important observations. Whether smaller or larger values are considered to be important can be controlled with the
value_sort_order field (see
In a heatmap for a generic assay profile important values are shown in darker shades of blue, whereas unimportant
values are shown in darker shades of red. The values represented by the pivot_threshold_value is shown in white. When
defined, the pivot_threshold_value will always be included in the legend, even when all datapoints are all more extreme.
In the Waterfall plot in Plots tab of Results view pivot_threshold_value determines the boundary between up- and downward
deflections in the plot.
When no sensible idea exists for a boundary between important and unimportant observations the pivot_threshold_value
field should not be defined (excluded from meta file). In this case all values will be shown as shades of blue in the
heatmap and the waterfall plot will show up- and downward deflections around 0.
Note on value_sort_order
The value_sort_order field can be used to indicate whether small or large value are considered to be more important.
When value_sort_order is ASC smaller values are considered to be more important. When value_sort_order is DESC
larger values are considered to be more important.
The default value for value_sort_order is ASC.
The value_sort_order is used by the Oncoprint when aggregating generic assay data in a tooltip that covers multiple samples
from a single patient. When value_sort_order is ASC the sample with the smallest response value will be shown for that
patient. When value_sort_order is DESC the sample with the largest value will be shown for that patient.
In the heatmap for a generic assay profile in results view data points with smaller values will show as darker blue
when the value_sort_order is ASC. When value_sort_order is DESC larger values are assigned a darker blue color.
The value_sort_order is used by the Waterfall plot for orientation of the x-axis so that important observations are
shown at the left side of the plot. When value_sort_order is ASC the x-axis will be in ascending order with smaller
values to the left. When value_sort_order is DESC the x-axis will be in descending order with larger values to the left.
Note on generic_entity_meta_properties
All meta properties must be specified in the generic_entity_meta_properties field. Every meta property listed here
must appear as a column header in the corresponding data file. It's highly recommend to add NAME, DESCRIPTION and an
optional URL to get the best visualization on OncoPrint tab and Plots tab.
Note on patient_level
Generic Assay data will be considered sample_level data if the patient_level property is missing or set to false.
In addition, the patient or sample identifiers need to be included in the
Note on Generic Assay genetic_alteration_type and datatype
All generic assay data is registered to be of the type of genetic_alteration_type and data type can choose from LIMIT-VALUE, CATEGORICAL and BINARY.
- LIMIT-VALUE: This datatype is intended to be used for any numerical data set with similar structure (entities measured in samples). The
LIMIT-VALUEis validated to contain any continuous number optionally prefixed with a '>' or '<' threshold symbol (e.g., '>8.00'). - CATEGORICAL (under development): This datatype is intended to be used for any categorical data set with similar structure (entities measured in samples). Any text is allowed in
CATEGORICAL. - BINARY (under development): This datatype is intended to be used for any binary data set with similar structure (entities measured in samples). The
BINARYis validated to contain only reserved text (true,false,yes,no).
If the value for the generic entity in the respective sample could not (or was not) be measured (or detected), the value should be 'NA' or leave that cell blank.
Generic Assay data file
The data file will be a simple tab separated format, similar to the expression data file: each sample is a column, each generic entity is a row, each cell contains values for that generic entity x sample combination.
For each generic entity (row) in the data file, the following columns are required in the order specified:
- ENTITY_STABLE_ID: Any unique identifier using a combination of alphanumeric characters, _ and -.
And:
- An additional column for each
generic_entity_meta_propertiesin the metafile, using the property name as the column header (e.g., 'NAME'). - An additional column for each sample in the dataset using the sample id as the column header.
Example with 3 generic entities and 3 samples:
| ENTITY_STABLE_ID | NAME | DESCRIPTION | URL | 1321N1_CENTRAL_NERVOUS_SYSTEM | 22RV1_PROSTATE | 42MGBA_CENTRAL_NERVOUS_SYSTEM |
|---|---|---|---|---|---|---|
| 17-AAG | Tanespimycin | Hsp90 inhibitor | https://en.wikipedia.org/wiki/Tanespimycin | 0.228 | 0.330 | 0.0530 |
| AEW541 | Larotrectinib | TrkA/B/C inhibitor | https://en.wikipedia.org/wiki/Larotrectinib | >8 | 2.33 | 2.68 |
| AZD0530 | Saracatinib | Src/Bcr-Abl inhibitor | https://en.wikipedia.org/wiki/Saracatinib | NA | >8 | 4.60 |
Arm Level CNA Data
Arm-level copy-number data is a predefined subtype of Generic Assay Data.
Allowed values for Arm-level copy-number data are Loss, Gain, and Unchanged, use NA or leave the cell blank to indicate a missing value.
Please find example file format here: Meta file example and Data file example
Mutational Signature Data
Mutational Signature data is a predefined subtype of Generic Assay Data. Setting generic_assay_type: MUTATIONAL_SIGNATURE
in the meta file will make cBioPortal interpret the data as Mutational Signature data.
Mutational Signature meta files
The mutational signature meta files follow the same convention as the
generic_assay_typeshould be set toMUTATIONAL_SIGNATUREdatatypeshould be set toLIMIT-VALUEstable_idvalues should end with_{filetype}_{version}, where:filetypeiscontribution,pvalue, orcountsversionis the analysis/version label shown in the UI (for examplev2,v3,SBS,DBS, orID)- Profiles that belong to the same mutational-signature analysis should use the same trailing
versionvalue across contribution/pvalue/count files - Different mutational-signature analyses in the same study should use different trailing
versionvalues
- Example
stable_idvalues:mutational_signatures_contribution_v2,mutational_signatures_pvalue_v2,mutational_signatures_counts_v2 - Contribution and pvalue profiles belonging to the same analysis should use the same trailing
versionvalue. - In
generic_entity_meta_propertiestheNAMEvalue is required.DESCRIPTIONandURLare recommended so the patient-view mutational-signature tab can show descriptive text and an external link for a selected signature. - If you want the patient-view legend/color grouping to reflect a signature category, encode it in
NAMEasENTITY_NAME (CATEGORY), since the frontend derives the category from the text in parentheses.
Mutational Signature data files
The mutational signature data files follow the same convention as the
- Signature contribution file (required)
- Data file containing the contribution of each signature-sample pair. Values are expected to be
0 <= x <= 1.
- Data file containing the contribution of each signature-sample pair. Values are expected to be
- Signature pvalue file (optional)
- Data file containing p-values for each signature-sample pair. Values below
0.05will be shown as significant.
- Data file containing p-values for each signature-sample pair. Values below
- Mutational counts matrix file (optional)
- Data file containing nucleotide changes of a sample. cBioPortal has specific visualization options for single-base substitutions (96 channels), double-base substitutions (72 channels) and insertion/deletions (83 channels), following the signatures defined by COSMIC. But other channels can also be used. Values are expected to be positive integers.
- Counts profiles belonging to the same analysis should use the same trailing
versionvalue.
Resource Data
The resource data is used to capture resource data in patients, samples and studies. The resources will be represented by URLs with meta data. The types of resources include:
- Files: pdf, txt, png, json, etc.
- Web links: non-file links e.g. URLs to other systems
the resource file is split into a resource definition file, sample resource file, patient resource file and study resource file. All data files are required to have a matching meta file.
Meta files
The resource metadata files have to contain the following fields:
- cancer_study_identifier: same value specified in meta_study.txt
- resource_type: value from (DEFINITION / SAMPLE / PATIENT / STUDY)
- data_filename: your datafile
Examples
An example metadata file, e.g. named meta_resource_definition.txt, would be:
cancer_study_identifier: brca_tcga_pub
resource_type: DEFINITION
data_filename: data_resource_definition.txt
An example metadata file, e.g. named meta_resource_sample.txt, would be:
cancer_study_identifier: brca_tcga_pub
resource_type: SAMPLE
data_filename: data_resource_sample.txt
Data files
Resource Definition Data File
The resource definition file should follow this format, it has three required columns:
- RESOURCE_ID (required): a unique resource ID. This field allows only numbers, letters, points, underscores and hyphens.
- DISPLAY_NAME (required): a display name for resources.
- RESOURCE_TYPE (required): resource type for resources, must be SAMPLE, PATIENT or STUDY.
- DESCRIPTION (optional): a discription for resources.
- OPEN_BY_DEFAULT (optional): define if the resource will be open by default (
true/false), dafault isfalse. - PRIORITY (optional): if not given, will give a default value.
Example Resource Definition data file
| RESOURCE_ID | DISPLAY_NAME | RESOURCE_TYPE | DESCRIPTION | OPEN_BY_DEFAULT | PRIORITY |
|---|---|---|---|---|---|
| PATHOLOGY_SLIDE | Pathology Slide | SAMPLE | The pathology slide for the sample | TRUE | 1 |
| PATIENT_NOTES | Patient Notes | PATIENT | Notes about the patient | FALSE | 2 |
| STUDY_SPONSORS | Study Sponsors | STUDY | Sponsors of this study | TRUE | 3 |
Sample Resource Data File
The sample resource file should follow this format, it has four required columns:
- PATIENT_ID (required): a unique patient ID. This field allows only numbers, letters, points, underscores and hyphens.
- SAMPLE_ID (required): a unique sample ID. This field allows only numbers, letters, points, underscores and hyphens.
- RESOURCE_ID (required): a unique resource ID which should also be included in the
Resource Definition data file. - URL (required): url to the resources, start with
httporhttps.
Example Sample Resource data file
| PATIENT_ID | SAMPLE_ID | RESOURCE_ID | URL |
|---|---|---|---|
| TCGA-A2-A04P | TCGA-A2-A04P-01 | PATHOLOGY_SLIDE | https://url-to-slide-sample1 |
| TCGA-A1-A0SK | TCGA-A1-A0SK-01 | PATHOLOGY_SLIDE | https://url-to-slide-sample2 |
Patient Resource Data File
The patient resource file should follow this format, it has three required columns:
- PATIENT_ID (required): a unique patient ID. This field allows only numbers, letters, points, underscores and hyphens.
- RESOURCE_ID (required): a unique resource ID which should also be included in the
Resource Definition data file. - URL (required): url to the resources, start with
httporhttps.
Example Patient Resource data file
| PATIENT_ID | RESOURCE_ID | URL |
|---|---|---|
| TCGA-A2-A04P | PATIENT_NOTES | https://url-to-slide-patient1 |
| TCGA-A1-A0SK | PATIENT_NOTES | https://url-to-slide-patient2 |
Study Resource Data File
The study resource file should follow this format, it has two required columns:
- RESOURCE_ID (required): a unique resource ID which should also be included in the
Resource Definition data file. - URL (required): url to the resources, start with
httporhttps.
Example Study Resource data file
| RESOURCE_ID | URL |
|---|---|
| STUDY_SPONSORS | https://url-to-study-sponsors |
Custom namespace columns
Adding annotation columns through namespaces
Custom columns can be added to the data files of mutations, structural variants and discrete copy number (long) data.
The columns can be imported through the namespace mechanism into a database table column called ANNOTATION_JSON. Any columns starting with a prefix specified in the namespaces field in the metafile will be imported into the database. Namespace columns should be formatted as the namespace and namespace attribute seperated with a period (e.g ASCN.total_copy_number where ASCN is the namespace and total_copy_number is the attribute).
An example cBioPortal mutation data file with the following additional columns:
ASCN.total_copy_number ASCN.clonal MUTATION.name MUTATION.typeimported with the following namespaces field in the metafile:
namespaces: ascnwill import the ASCN.total_copy_number and ASCN.clonal column into the database. MUTATION.name and MUTATION.type
will be ignored because mutation is not specified in the namespaces field.
Representation of namespace columns by mutation API endpoints
Columns added through namespaces will be returned by relevant mutation, discrete copy number and structural variant API
endpoints. Namespace data will be available in the namespaceColumn of respective JSON representations of mutation
records. The namespaceColumns property will be a JSON object where namespace data is keyed by name of the namespace in
lowercase. For instance, when namespace ZYGOSITY is defined in the meta file and the data file has column
ZYGOSITY.status with value Homozygous for a mutation row, the API will return the following JSON record for this
mutation (only relevant fields are shown):
{
    "namespaceColumns": {
        "ZYGOSITY": {
            "status": "Homozygous"
        }
    },
}
Note: ASCN namespace data is not exported via the namespaceColumns field.
Representation of namespace columns in the cBioPortal frontend
Namespace columns will be added as columns to mutation, structural variant and copy number alteration tables in Patient View and Results View. The case of the namespace in the column header will be as specified in the mutations meta file and the column name will be capitalized.
For instance, this metafile entry:
namespaces: Zygosityand this column header:
ZYGOSITY.statuswill show in the mutation table with column name:
Zygosity StatusNote: namespace columns are recognized by a case-insensitive match of the namespace reported in the meta file and the first word in the column header.